Number : Real Numbers
Connections With Other Strands
Numbers are an integral part of all areas of mathematics. In Grade 9, students use their understanding of number sense and operations to solve problems in a variety of contexts and situations. The examples below illustrate how the Number strand is applied in other areas of study.
When examining each question, reflect on the knowledge and skills from the overall and specific expectations in the Number strand that students will use, as well as the connections to the key concepts.
Algebra: Solving Equations
Specific Expectations: B3.2, B3.5, C1.5
Mathematical Processes: Connecting, Selecting Tools and Strategies
A student determines that they can run \(1\frac{1}{4}\) laps of the track in 2 minutes.
- Create an Equation: Determine an equation to show the relationship between the amount of time they run, t, in minutes, and the distance they run, d, in kilometres.
- Make a Prediction: A lap of the track is 400 metres long. Using your equation, determine how many minutes it will take the student to run 5 kilometres.
Data: Statistical Measures
Specific Expectations: B3.5, D1.2, D1.3
Mathematical Processes: Representing, Selecting Tools and Strategies
Students will collect and analyze data on the sales of two food items in the school cafeteria over a significant period. They will use their findings to calculate percentages, ratios, and represent the data using appropriate statistical methods.
- Collect Data: Over an appropriate period, record the number of each type of chosen food item sold in the school cafeteria.
- Calculate Percentages and Ratios: Determine the percentage of each type of chosen food item sold relative to the total sales.
- Create Visual Representations:
- Create a pie chart to show the percentage distribution of the chosen food sales relative to the total sales.
- Perform a statistical analysis for each type of chosen food using measures of central tendency and box plots.
Geometry and Measurement: Modified Dimensions
Specific Expectations: B3.5, E1.3, E1.4
Mathematical Processes: Reasoning and Proving, Selecting Tools and Strategies
Students receive this image or a model made with materials (for example, interlocking cubes).
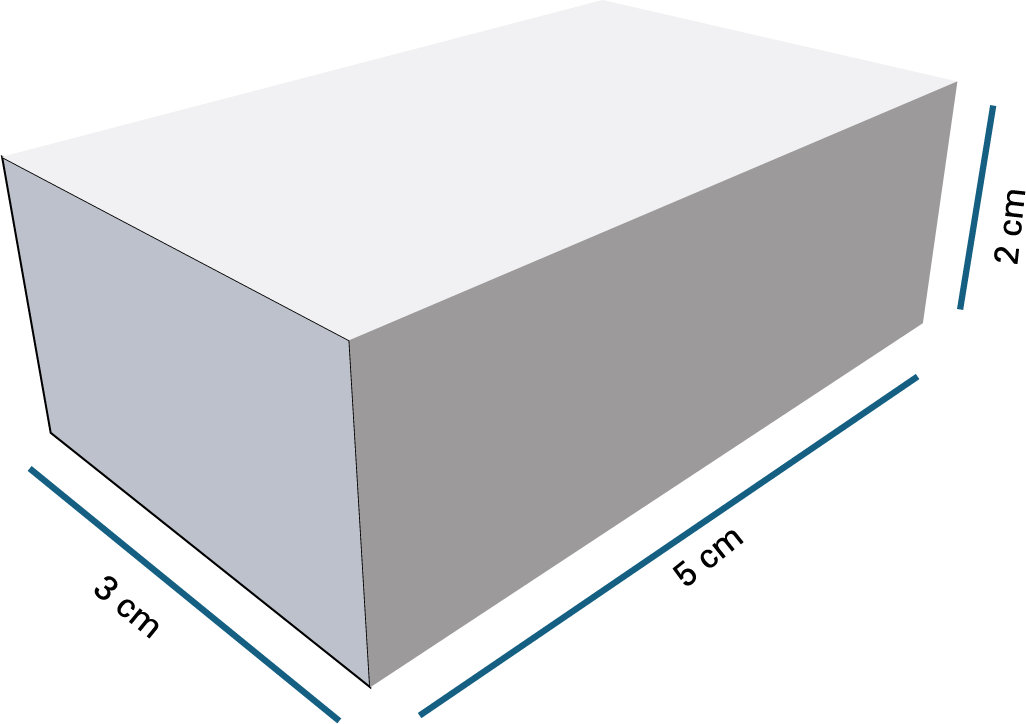
- Design a Box: Design a similar box that will have 12 times the volume.
- Calculate the Total Surface Area: Determine the total surface area of the box.
- Determine the Amount of Wood to Buy: Determine the amount of square feet of wood needed to construct the box.
Financial Literacy: Interest
Specific Expectations: B2.1, B3.5, F1.2, F1.3
Mathematical Processes: Reflecting, Selecting Tools and Strategies
Students will compare different savings plans to determine which one offers the best return over a given period. They will calculate interest, analyze the effects of different interest rates and compounding periods, and consider the impact of additional deposits.
- Research Savings Plans: Identify three different savings plans offered by banks, including details on interest rates, compounding periods of the interest, and any additional fees.
- Calculate Interest: For each savings plan, calculate the total amount of money that would be accumulated over a five-year period, starting with an initial deposit and regular monthly deposits.
- Compare Plans: Create a comparison table that shows the total amount accumulated, the total interest earned, and any related fees for each plan.
- Make a Recommendation: Based on the calculations, determine which savings plan offers the best return and explain the reasoning behind the recommendation.
Multi-Strand Task
Specific Expectations: B3.5, C3.1, D1.2, D1.3
Mathematical Processes: Problem Solving, Communicating, Selecting Tools and Strategies
Students will analyze the performance statistics of two basketball players who play the same position over a season. (Students can choose two players from any sport.) They will use concepts from the Number, Algebra, and Data strands to calculate averages, create graphs, and model relationships. The use of technology emphasizes data analysis and drawing conclusions rather than creating diagrams.
- Collect Data: From a table of performance statistics (for example, points scored per game, assists, minutes played per game), select 3 to 5 data points and organize them appropriately to enable a comparison of the two players.
- Calculate Measures of Central Tendency: Determine the measures of central tendency for each chosen statistic.
- Create Visual Representations: Use box plots for one or two statistics to visually compare the two player performances over the season.
- Model Relationships: Use the data to create a linear or non-linear model that predicts future performance based on past trends.
- Draw Conclusions: Following data analysis, what conjectures might you make to the coach about the two players?
Reflection
- What can be reconsidered in the lesson planning to allow students to demonstrate a deeper and more diverse understanding of number sense and mathematical operations?
- What can be modified and improved in my teaching practices to encourage students to explore and deeply understand the application of numbers in a variety of mathematical contexts and real-life situations?