Algebra : Expressions, Equations, and Inequalities
Instructional Tools & Strategies
“At the heart of algebraic reasoning are generalizations as expressed by symbols. Traditionally, algebra was often presented in secondary school as a predetermined syntax of rules and symbolic language to be memorized by students. Students were expected to master the skills of symbolic manipulation before learning about the purpose and the use of these symbols. In other words, algebra was presented to students with limited opportunity for exploration or for meaning making. However, the Ontario mathematics curriculum specifies that students be provided with a range of opportunities for exploration and meaning making.” (Ontario Ministry of Education, 2013, Paying Attention to Algebraic Reasoning, p. 7). By encouraging students to use and compare a variety of strategies and tools, they can develop a conceptual understanding of algebra.
Algebraic Expressions
To simplify algebraic expressions, students need to draw on their understanding of operations with rational numbers as well as exponents. The use of manipulatives helps develop a conceptual understanding of operations on algebraic expressions. All students should be encouraged to demonstrate their understanding using a variety of representations, including manipulatives. Here are some useful tools and strategies that can be used to simplify algebraic expressions.
| Algebraic Expression | Tools | Strategies |
|---|---|---|
| Multiplying monomials with monomials and polynomials |
|
|
| Adding and subtracting monomials | Algebra tiles |
|
Equations
Algebraic equations are used to represent a variety of situations and contexts. Understanding and making connections between different types of equations allows students to select appropriate and effective tools and strategies for solving problems involving equations.
Here are some examples of equations, tools, and possible strategies according to the type of equations.
| Equation Type | Example | Possible Tools | Strategies |
|---|---|---|---|
| An algebraic identity (always true) | \begin{align}3x + 5x &= 8x \\ 2x(3x − 5) &= 6x^2 − 10x\end{align} |
|
|
| Relationship between two variables (dependent and independent) | \begin{align}C &= 12h + 35 \\ y &= −3x + 12 \\ x + y &= 24\end{align} |
|
Making connections between multiple representation tools to develop an understanding of the relationships between two variables. |
| Formulas | \begin{align}V &= πr^3 \\ A &= 2πr^2 + 2πrh\end{align} |
|
|
| Solving equations | \begin{align}3(4x − 5) &= 8x + 11 \\ 23x + 35 &= 56x − 45\end{align} |
|
|
Example of solving the equation \(\frac{2}{3}x+\frac{3}{5}=\frac{5}{6}x-\frac{4}{5}\) using an open double number line.
| Explanation | Visual Representation | Symbolic Representation |
|---|---|---|
| Since the two sides of the equation are equal, they end up at the same point on the number line. | 
A vertical line gives one point. Above this point, there is an equation: 2 thirds « x » plus 3 fifths. Below the vertical line, there is another equation: 5 sixths « x » minus 4 fifths. |
\begin{align}\frac{2}{3}x+\frac{3}{5}=\frac{5}{6}x-\frac{4}{5}\end{align} |
| I choose to subtract \(\frac{2}{3}x\) from the top to have the variable on the bottom only. | 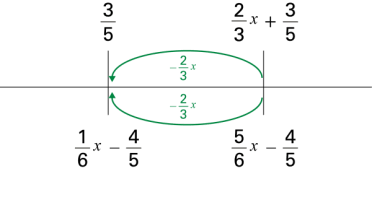
There are two vertical marks placed on this line, each mark representing a specific value on the number line. Above the first mark, which is further to the right, there is the following equation: 2 thirds « x » plus 3 fifths. Below this mark, there is the following equation: 5 sixths « x » minus 4 fifths. The second mark is placed to the left on the line. Below this mark, there is the following fraction: 3 fifths. Below the mark, there is the following equation: 1 sixth « x » minus 4 fifths. Between the two marks, there are two green arrows. They both start from the right mark and point to the left mark. The first is above the line and the second below. Each of the arrows is accompanied by the following fraction: Negative 2 thirds « x ». |
\begin{align}\frac{2}{3}x-\frac{2}{3}x+\frac{3}{5} &= \frac{5}{6}x-\frac{2}{3}x-\frac{4}{5} \\ \frac{3}{5} &= \frac{1}{6}x-\frac{4}{5}\end{align} |
| Upon observing the expressions on the number line, I know that when I subtract a quantity, I move to the left. Therefore, I can deduce that \(\frac{1}{6}x\) will be \(\frac{4}{5}\) to the right of \(\frac{1}{6}x-\frac{4}{5}\). | 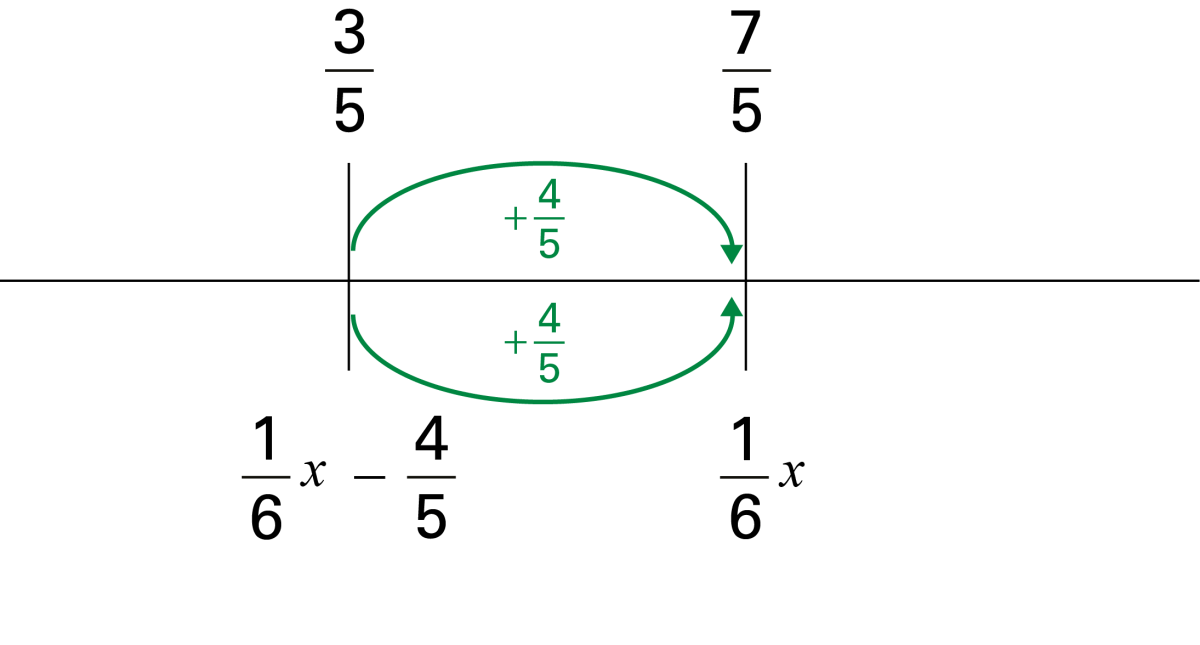
There are two vertical marks placed on the line, each mark representing a specific point on the number line. Above the first mark, which is further to the left, there is the following fraction: 3 fifths. Below this mark, there is the following fraction: 1 sixth « x » minus 44 fifths. The second mark is placed to the right on the number line. Above this mark, there is the following fraction: 7 fifths. Below the mark, there is the following equation: 1 sixth « x » minus 4 fifths. Between the two marks, there are two green arrows. They both start from the left mark and point to the right mark. The first is above the line and the second below. Each of the arrows is accompanied by the following fraction: Positive 4 fifths. |
\begin{align}\frac{3}{5}+\frac{4}{5} &= \frac{1}{6}x-\frac{4}{5}+\frac{4}{5} \\ \frac{7}{5} &= \frac{1}{6}x\end{align} |
| I can make 6 jumps of \(\frac{1}{6}x\) on the number line to determine where \(x\) will be. I can also make 6 jumps of \(\frac{7}{5}\). I therefore finish at \(\frac{42}{5}\) on the number line. | 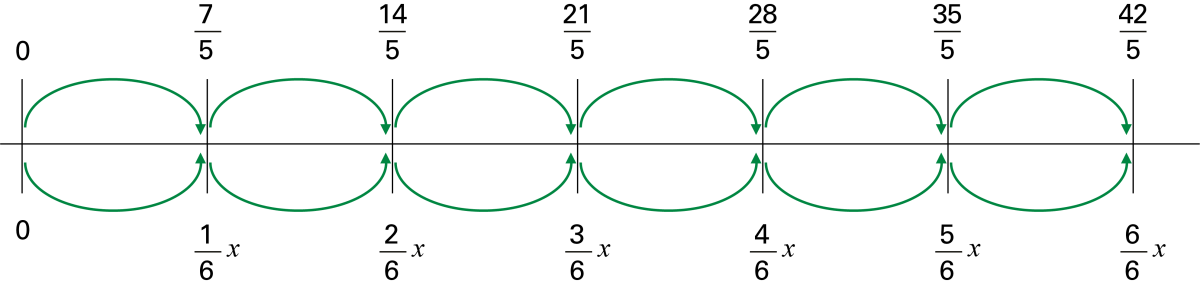
Each jump is expressed by two different expressions. The first jump starts from point zero. First point: 7 fifths or 1 sixth « x ». Second point: 14 fifths or 2 sixths « x ». Third point: 21 fifths or 3 sixths « x ». Fourth point: 28 fifths or 4 sixths « x ». Fifth point: 35 fifths or 5 sixths « x ». Sixth point: 42 fifths or 6 sixths « x ». |
\begin{align}\frac{7}{5}\times 6 &= \frac{1}{6}x\times 6 \\ \frac{42}{5} &= x\end{align} |
The solution to this equation is \(x=\frac{42}{5}\) or \(8\frac{2}{5}\).
Note : The student could have started with any terms. In some cases, it would have been necessary to use the symmetry of the number line if the coefficient of \(x\) is negative.

These points are represented in two ways. The first point: negative 1 sixth « x » or negative 7 fifths. The second point: zero. The third point: 1 sixth « x » or 7 fifths.
Example of solving the equation \(\frac{2}{3}x+\frac{3}{5}=\frac{5}{6}x-\frac{4}{5}\) using equivalent fractions.
| Explanation | Visual Representation | Symbolic Representation |
|---|---|---|
| I notice that all terms in the equation involve fractions | \begin{align}\frac{2}{3}x+\frac{3}{5}=\frac{5}{6}x-\frac{4}{5}\end{align} | |
| I can express all fractions with equivalent fractions with a denominator of 30. | \begin{align}\frac{20}{30}x+\frac{18}{30}=\frac{25}{30}x-\frac{24}{30}\end{align} | |
| I can multiply each term of the equation by 30 to create whole numbers coefficients. | \begin{align} \frac{20}{30}x \times 30 + \frac{18}{30} \times 30 = \frac{25}{30}x \times 30 - \frac{24}{30} \times 30 \end{align} | |
| I can use algebra tiles from this point to represent the equation since the coefficients are whole numbers. | 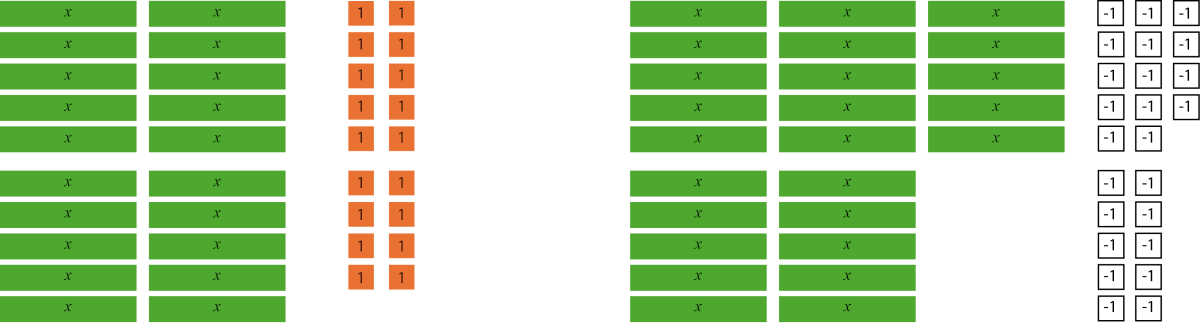
First, there are 4 groups of 5 green tiles « x » and 18 orange tiles of one. Next to them, there are 5 groups of green tiles « x » and 18 white tiles, negative one. |
\begin{align}20x+18=25x-24\end{align} |
| Using the principle of the balance model (or algebra tiles), I find that I can remove \(20x\) from each side. | 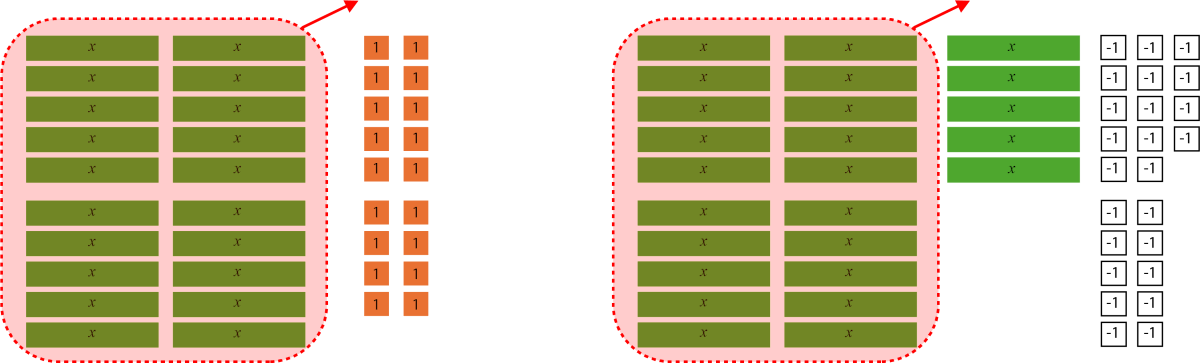
First, there are 4 groups of 5 green tiles « x » and 18 orange tiles of one. Next to them, there are 5 groups of green tiles « x » and 18 white tiles, negative one. On each side, 20 tiles of « x » are circled in red and an arrow points upward. |
\begin{align}20x-20x+18 &= 25x-24-20x \\ 18 &= 5x-24\end{align} |
| I can also add 24 on each side to create zero pairs. | 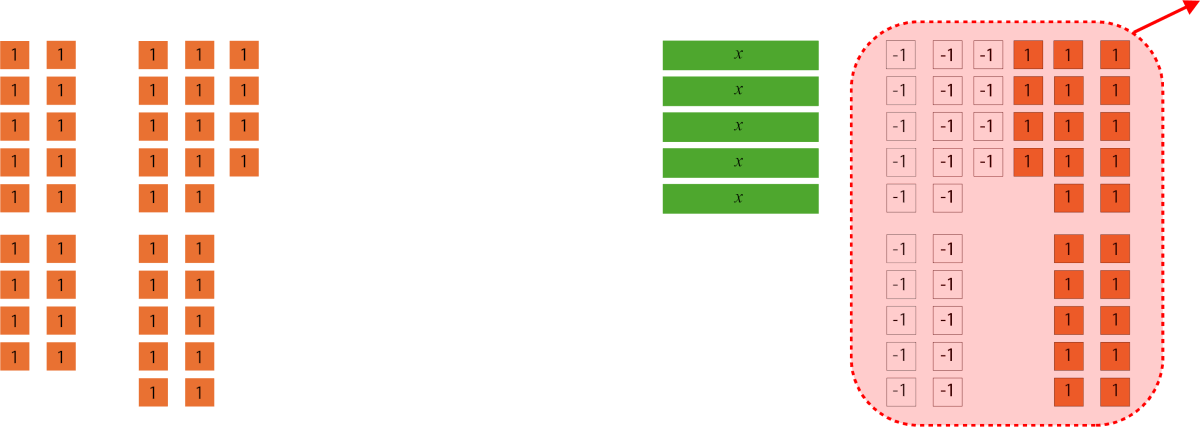
On the left, there are 6 groups of 5 orange tiles and 3 groups of 4 orange tiles. On the right, there is a group of 5 green tiles and, circled in red, 24 white tiles of negative one and 24 orange tiles of one. A red arrow starts from this circled group and points upward. |
\begin{align}18+24 &= 5x-24+24 \\ 42 &= 5x\end{align} |
| I then divide 42 into 5 equal groups to determine the value of \(1x\). | 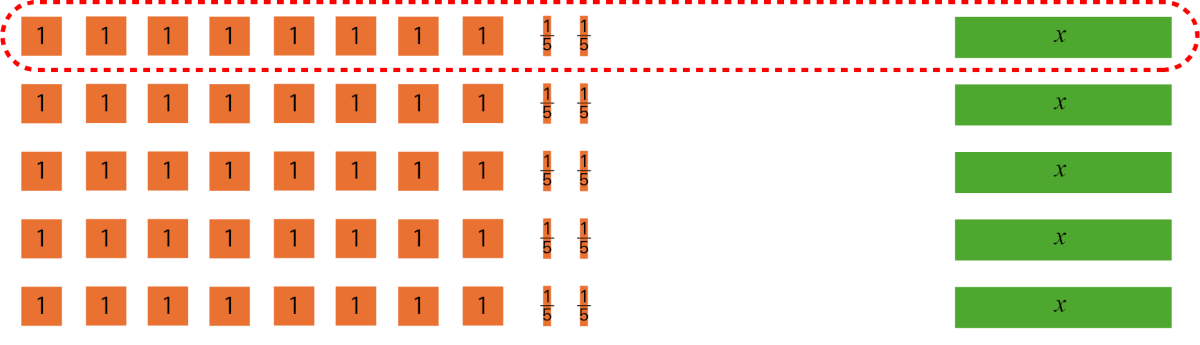
There are 5 rows of tiles, and they are identical. Each row consists of 8 orange tiles of one, 2 orange tiles of one fifth, and one green tile « x ». The first row is circled by a red dotted line. |
\begin{align}42\div 5 &= 5x\div 5 \\ x &= \frac{42}{5}\ or\ 8\frac{2}{5}\end{align} |
The solution to this equation is \(x=\frac{42}{5}\) or \(8\frac{2}{5}\) or 8.4.
Inequalities
The use of technology and dynamic graphing applications enables students to make conjectures by observing patterns in many examples in a short amount of time. They will then be able to generalize using these tools.
By examining the four equations below, their corresponding graphs, and their intercepts, students can make conjectures and generalize about the relationships between the coefficients, the constant terms, and the intercept values.
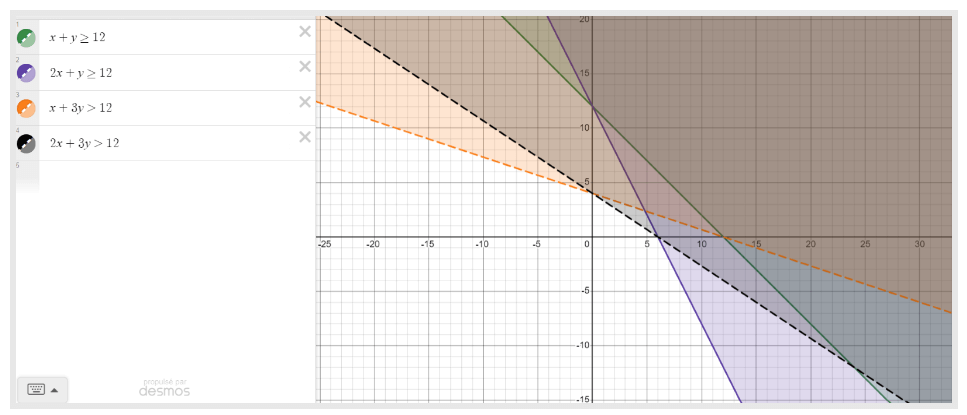
The lines all start in the first quadrant, cross the second, and go down into the fourth, avoiding the third. Each line has a colour and projects a shaded area of the same hue to its right in the plane. The first line is full, green, and has the equation x + y is greater than or equal to 12. The second line is full, purple, and has the equation 2x + y is greater than or equal to 12. The third line is dotted, orange, and has the equation x + 3y is greater than or equal to 12. And the fourth line, dotted and black, has the equation 2x plus 3y is greater than or equal to 12.
To represent the solution set of the inequality \(2x+3y\ge 12\), which is the shaded region, students can first solve the equivalent equation \(2x+3y=12\) using the strategies presented in the previous section and plot the line. This line represents the boundary of the solution set. Students can then choose a point on either side of the line to determine if that point is part of the solution set of the inequality. If the coordinates of the point satisfy the inequality, the point is part of the solution set and will be included in the shaded region of the graph.
Reflection
- How does the use of a variety of concrete, semi-concrete, word-based (written or oral) representations, or real-life contexts help students to develop an understanding of algebra so that symbolic representations make more sense to them?
- How can the graphical representation of equations and inequalities provide additional insights into solutions and their interpretation?
- What are the effects of making the various strategies used by the students visible and available to the whole class?
- How can we encourage the use of a strategy other than the mechanical application of an algorithm to develop students’ deep understanding of algebraic concepts?